Morningstar Direct
Access
Morningstar Direct is a web-based research platform ideal for developing, selecting, and monitoring investments, including Open End Funds, Separate Accounts, Exchange-Traded Funds, Stocks, Variable Annuity Products, Stocks and much more. Its all-in-one design supports competitive analysis, performance evaluation, manager due diligence, and portfolio creation.
All Rotman faculty and graduate students from Rotman programs will have access to Morningstar Direct. Morningstar is accessible in person from the physical computers located at the St George Campus are located in the FRT-Lab (Rotman School of Management, Room 290 North Building) and Milt Harris Library (Rotman School of Management, 5th Floor South Building).
⮞ To Request Access, Click here .
Guides
- Morningstar Direct Getting Started guide: View Guide.
- Get an overview of Morningstar Direct: View Guide, Watch Video.
- Learn how to create an Investment List for competitive analysis, Specific Screening of investments and more: View Guide, Watch Video.
- Learn how to create custom Data Sets & Calculations: View Guide.
- Learn how to find Morningstar’s Methodology & Data Definitions in Morningstar: View Guide.
- Take the Basic Level Certification Exam to test your knowledge: Take Exam.
Getting Started
Morningstar Direct is organized by folders. When you login, you begin in Home. The left navigation for each folder works in a similar fashion. The Main Menu bar at the very top does not change regardless of where you are in the application.
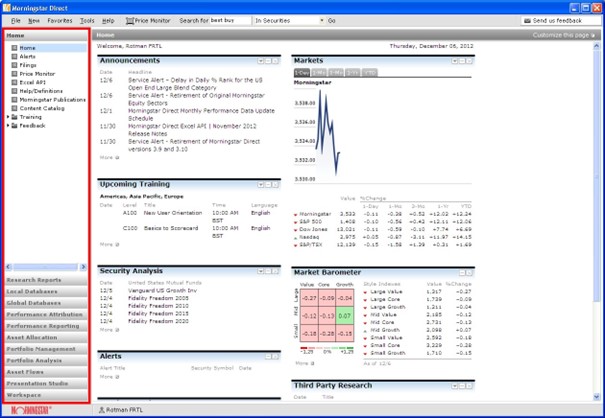
Morningstar Direct Folders
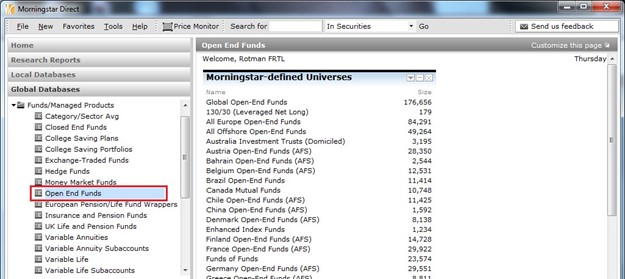
- Go to Global Databases and click on a folder to reveal its subfolders — for example, those listed under Funds/Managed Products on the left where the view in this image defaults to Open-End Funds.

2. Within the Open End Funds universe, all the Morningstar-Defined Universes are listed on the right.
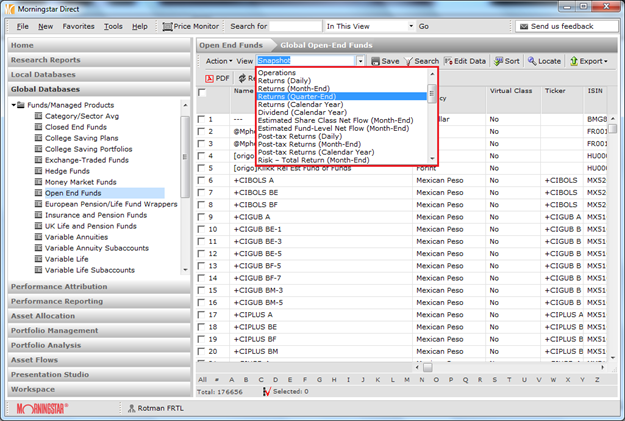
3. Click on a file to access its content in the grid. For this example, click Global Open-End Funds.

4. In the grid view, go to the View drop-down and toggle to any pre-defined data points to populate the See the Custom Data Sets and Calculations chapter for more detail.
Basic Functions of Main Folders
- Home: The Home page contains many “apps” that help users stay informed of product updates, training, definitions, data, market commentary, research updates, and more.
- Research Reports: Use the Research folder to access equity, credit, and alternative investment research reports. Allows to evaluate stock performance with streaming real-time data and to have a better understanding of the intrinsic value of a stock.
- Local Databases: Local Databases provide access to Morningstar’s fund databases specific to the local country specified in User Preferences.
- Global Databases: Global Databases provide access to Morningstar’s fund databases across all countries.
- Performance Attribution: Create reports of your portfolio to decompose the excess return and identify the impact of investment decisions, and identify excess return based on asset allocation and manager selection.
- Performance Reporting: Streamline and simplify your performance reporting process for various investments across multiple asset classes and custom groups. Select peer groups, specify performance periods, and customize benchmarks to monitor your results. Use the scorecard to conduct further analysis by creating custom grades to calculate the overall scores of your list of investments.
- Asset Allocation: Use the asset allocation tool to create optimal asset allocation policies for specific investment goals. Develop asset class assumptions, identify your target portfolio(s), and forecast future performance.
- Portfolio Management: Build model portfolios and import private investments.
- Portfolio Analysis: Use real-time portfolio analysis to help monitor your portfolio and make better investment decisions.
- Asset Flows: Take advantage of comprehensive, worldwide asset flow data to assess investor trends and perform competitive analysis, develop new products, and market-managed investment products. Start with aggregated data, drill down to specific findings, and export data for further analysis.
- Presentation Studio: Create professional, custom-branded fact sheets and presentations, incorporating your company’s logos, colours, fonts, and custom disclaimers. Start with pre-built Morningstar templates or design your own, using data from Morningstar’s database or your imported proprietary investment data. Save your report as Adobe PDF documents or Microsoft PowerPoint files for easy sharing and distribution.
- Risk Model: Adds transparency to the risk added to your portfolio. With some pre-defined scenarios, estimate the probability of future price movements and gain deeper insight into potential drivers of risk and volatility. Portfolios that have more exposure to large future price movements are highlighted as riskier.
- Workspace: Workspace is the electronic file cabinet for Morningstar Direct. Build data sets directly from this area or modify information in the local or global databases to be stored in Workspace.
- Analytics Lab: Analytics Lab combines access to all of Morningstar’s data and research with Jupyter Notebook, an open-source data science tool, to give users a flexible coding environment that’s built for rigorous analysis.
Searching with Morningstar Direct
The Search Criteria in Morningstar Direct generates a set of investments that currently match the criteria defined. Each time the file is retrieved from the Search Criteria folder, the members are redefined using the set parameters.
Create a Basic Search
- Go to the Search Criteria folder and click My Search Criteria.
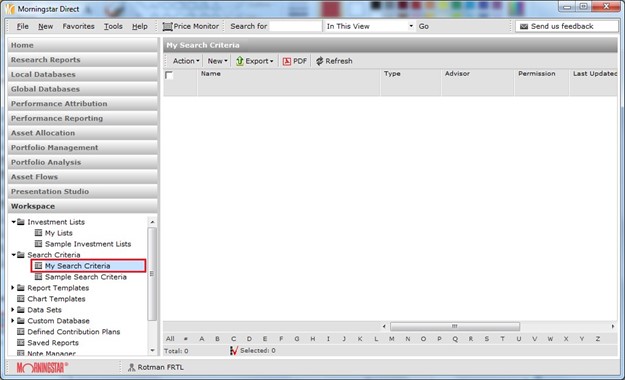
2. Go to New and select Basic Search.

3. To the right of Basic Search, select Open End Funds to open the basic search

4. Under the Basic section, click 5-Star Morningstar Rating

5. Under the Performance section, change the Category Rank for 3 Year Return to 20 and

6. Click Run Search to preview the number of investments meeting the criteria under Items

7. Click OK to view

8. The Basic Search was successfully
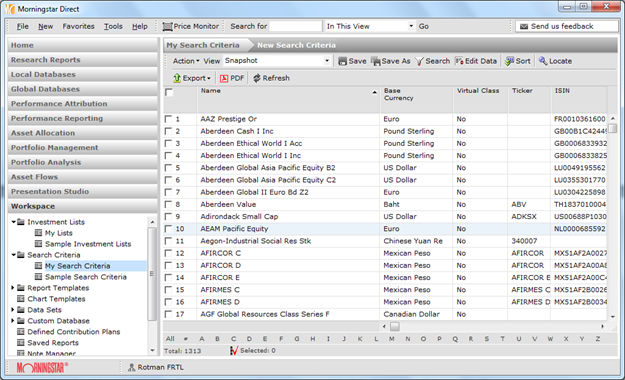
Create an Advanced Search
- Go to the Search Criteria folder and click on My Search
2. Go to New and select Advanced

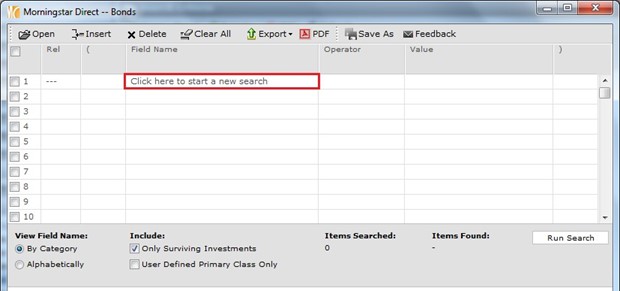
3. To the right of Advanced Search are the universes available to create specific search criteria. For this example, click Bonds to open the advanced search window.

4. Click into the box that says Click here to start a new
5. Go to the Field Name column and click on Base Currency located under
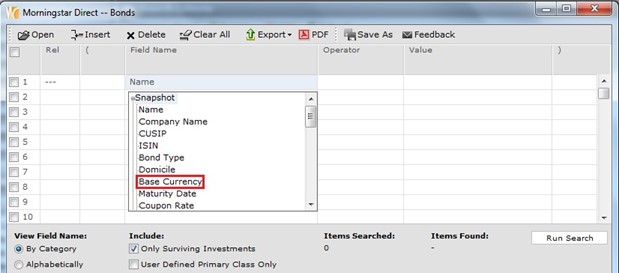
6. Notice that by default, field names are displayed by Category groupings but can be viewed

7. Go to the Operator column and enter the = operator.

8. Go to the Value column and select Canadian.

9. Click Run Search to preview the number of investments that met the search.
10. Go to line two. In the Rel column, select Or to add additional search criteria.

11. Follow steps four to eight to add the Base Currency to the search

12. If we were to select And in line two instead of Or when adding the second search criteria, the search would not yield results since an investment cannot be listed in more than one category at a time.
13. Click Run Search to preview number of investments meeting the criteria.
14. Go to line three and select And in the Rel column.
15. Add the following parameters in line three: Field Name column = Bond, operator is =, and Value is Corporate Bonds.

16. Click Run Search to preview a number of investments meeting the criteria. The new Items Found represent all CAD-based bonds and only USD-based corporate bonds.
17. To identify the corporate bonds based in both the CAD and USD, add “(“ to the beginning of line 1 and “)” to the end of line 2.

18. Click Run Search to preview number of investments meeting the criteria. The Items Found now represents only CAD-based and USD-based corporate bonds.
19. Click OK to view the investments that meet the search criteria.
20. The Advanced Search was successfully completed.
Excel Add-in
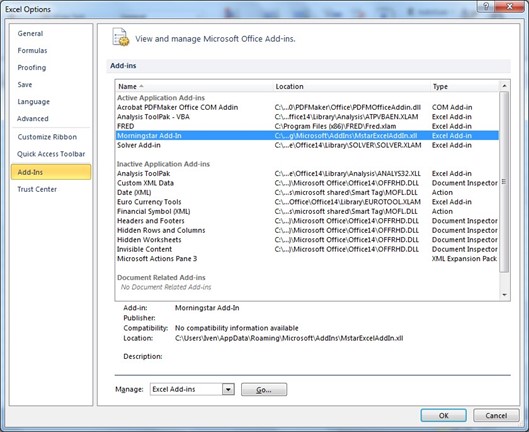
- If Morningstar Direct Add-In is enabled, you will be able to see Morningstar Direct on the toolbar.
2. If not, please contact finance lab assistants, and we will help you install or enable that.
Retrieving Data
- To retrieve data of security using Morningstar Direct Excel Add-in, go to Add-Ins > Morningstar, and select Investment Data.

2. Then, you will specify the security by name or symbol. In this tutorial, we will choose IBM.


3. After that, we will specify the data point for IBM, and we want a close price.
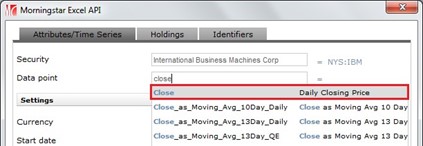
4. To look up the definition of the data point chosen, click on the hyperlinked name.
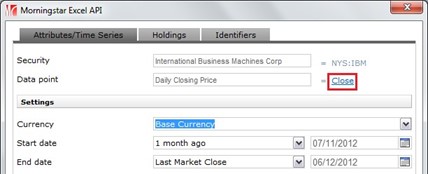

5. Once you’ve selected your security and data point, the other default settings will be applied. Note that “Show dates” is not selected as default.
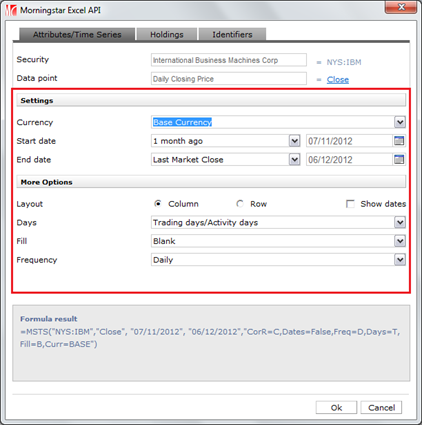
6. When you are done choosing your settings, click OK, and the data retrieving is completed.
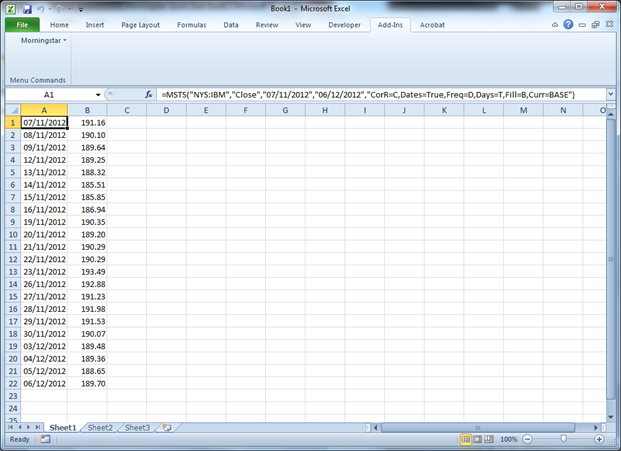
7. If you want to change anything with the data you’ve downloaded, make sure the top left corner of the data is selected, and then go to Add-In > Morningstar > Investment Data again.

