The Algorithmic CAPM Forecasting Case is designed to challenge participants’ programming skills by developing algorithms using the RIT API to forecast future asset prices and automate trading strategies. Throughout the case, these algorithms will capture the historical prices of the securities, estimate market sensitivities with beta, forecast future asset return using CAPM model, identify price trend and submit orders to profit from private information about the changing market movement. Due to the high-frequency nature of the case, participants are encouraged to develop algorithms that can adapt to rapid changes in market dynamics using their selected programming languages.
KEY OBJECTIVES
Develop a forecasting algorithm model using the provided template to assess the influence of private news on the future prices of both the market index and individual stocks. Explore the utilization of tick-by-tick historical last prices to gauge the sensitivity of stock prices to market risk. Integrate this data into the CAPM model to predict future stock price movements.
Construct a trading algorithm designed to identify profitable investment opportunities by forecasting future returns earned on individual tradable stocks. Compare these forecasts across the available stocks to pinpoint potentially profitable investment avenues.
Support Scripts - Python
The Algo CAPM case includes one basic algo script written in Python script. be aware that the Python scripts are basic and you need to develop them to support your trading strategy.
Click below to download the scripts in one zip compressed folder:
In this case, only one team member will have Trader role:
ABCD-1: Role of Algo Trader
Algorithmic Trading Case: Any one member may represent the team in the single role in this Case.
DESCRIPTION
Only one team member shall trade to represent the team for all heats. Each heat will be aroun 200 seconds long representing one months of trading, where 50 ticks represent 1 trading week.
Trading time per heat: 400 seconds
Calendar time per heat: Two month of trading
Order submission using the RIT API will be enabled. Data retrieval via Real-time Data (RTD) Links and the RIT API will also be enabled. All trades must be executed by a trading algorithm. Participants will not be allowed to trade manually through the RIT Client once the heat begins. Participants are allowed to modify their algorithms in response to prevailing market conditions and competition from the algorithms of other teams. They will have 1 minute between each heat to re-load their algorithms. A base template algorithm will be provided [1] to participants and can be directly modified for use in the competition. However, participants are encouraged to create their own algorithms.
At the beginning of each heat, participants are provided with information about the prevailing risk-free rate derived from the 10-year Government bond yield, along with the initial beta coefficients for each stock. This information aids in assessing potential excess returns relative to the market premium, facilitating the initial determination of assets’ correlation or sensitivity to the market index. The beta coefficient is subject to change based on market movements and evolves over the course of the case.
Throughout the trading simulation, participants will receive various insights from private analysts, outlining expectations for future market index prices. These updates must be leveraged to calculate the anticipated return on the market index. Subsequently, participants integrate this information with the calculated beta into the predictive CAPM model to forecast future price movements in each tradable asset. Profit opportunities can be captured by executing algorithmic limit or market orders aligned with their forecasted price outcomes.
[1] The “Base Algorithm” will be released on the RITC webpage as outlined in the “Important Information” section above.
MARKET DYNAMICS
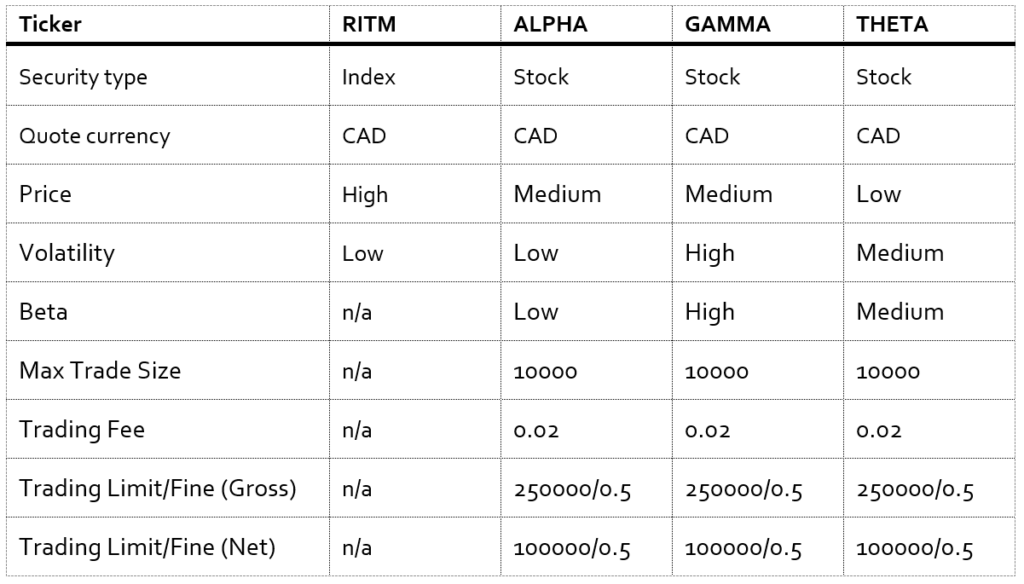
This case involves four securities with the following details:
Throughout the simulation period, participants will receive weekly confidential updates about the projected future price of the RIT Market Index (RITM). A total of 8 private news releases will be distributed at various intervals of each week, providing details about the expected RITM price for the upcoming da
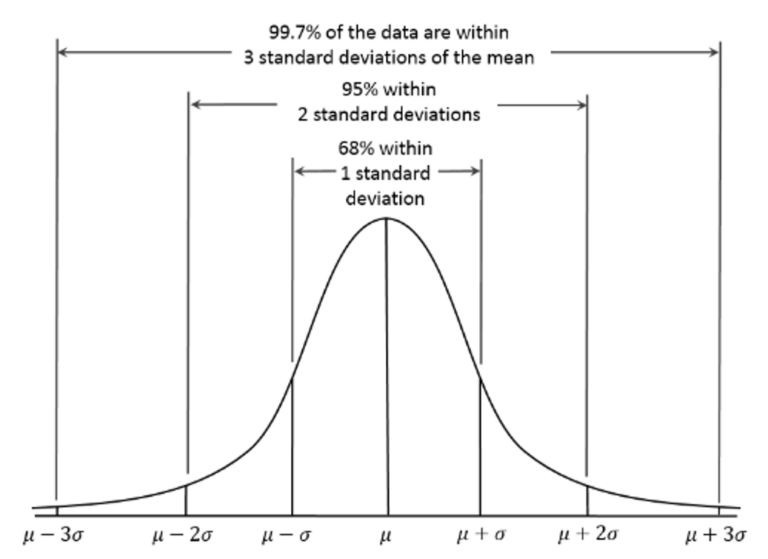
Participants can leverage this information to calculate the future return on the market index and subsequently use it to make predictions about the future prices of securities with the utmost accuracy. The precision of these predictions depends on the margin of error associated with the analyst’s forecast of the market index price. It is important to recognize that analysts’ predictions may not be entirely precise when forecasting market index prices. Therefore, participants should consider a certain margin of error in their asset return calculations. This margin of error, denoted as X, follows a standard normal distribution as outlined below:
For instance, a perfect forecast of the market price implies that the margin of error will be minimal, approaching zero. There is a 99.7% likelihood that the error falls within the three standard deviations from the mean of the error distribution.
Participants can use the expected market return along with their estimated time-varying beta within the fundamental CAPM model to project the expected return from a particular stock. The basic CAPM model is represented by the following equation:
where:
E[Ri] is the expected return of investment on stock i
Rf is the risk-free rate
ꞵt,i is the beta of stock i at time t
Rm is the forecasted market return on RITM
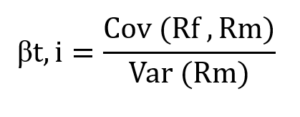
To calculate beta sensitivity of the stock, participants need to gather historical prices for all assets. Historical prices can be collected from the inception, and participants can estimate beta using the following function:
Alternatively, beta is equal to the slope coefficient when the historical return of market index is regressed on the historical returns of a stock.
The expected return predicted by the CAPM model serves as a valuable tool for participants to analyze potential price shifts in each tradable security. This enables participants to formulate investment strategies by evaluating the predicted price against the market price and conducting a risk-return analysis across all stocks. The projected price serves as a basis for generating profits through the placement of limit or market orders. It is advisable to refrain from employing market-making strategies and submitting large orders, as these actions can cumulatively impact asset prices and indirectly influence the investment strategies derived from predictive analysis.
TRADING/POSITION LIMITS AND TRANSACTION COSTS
Participants can be assured about the liquidity of securities, as computer-generated traders consistently place buy and sell orders marked as ‘ANON’ in the order book. These computer traders operate within calibrated parameters to meet specific market requirements and lack foreknowledge of future asset price movements. Consequently, they place buy and sell orders with equal probability, accompanied by prices randomly generated from a normal distribution centered around the mid-market price.
In addition, there is a trading limit set at 250,000 shares gross and 100,000 shares net. Once this limit is surpassed, participants are unable to execute additional trades, and a penalty of 50 cents per share is incurred. The maximum order size for any single order, whether long or short, is capped at 10,000 shares. Furthermore, a commission of 2 cents per share is applied to each transaction involving the tradable stocks.
POSITION CLOSE-OUT
All non-zero stock positions will be liquidated at the conclusion of the trading session, using the last traded price as the reference price of the asset.