Produced by Standard & Poor’s, Capital IQ is a web and Excel-based software that provides valuable financial research data on fundamental analysis, financial modeling, and market analysis. Capital IQ is widely used in the financial industry by financial professionals, investors, and analysts to gather and analyze financial data and perform investment research, equity analysis, credit analysis, due diligence, and other financial-related tasks. It contains comprehensive information on over 60,000 public companies, 685,000 private companies, 10,600 private capital firms, 312,000 transactions, and 985,000 professionals worldwide. The Financial Analysis and Market Analysis components allow users to draw deep market insights from comparable analysis, sector analysis, and a high-level overview of industries. In addition, the Screening and Targeting function incorporates over a thousand financial and non-financial screening criteria to construct a list that meets your requirements.
Access
All Rotman faculty, graduate, and undergraduate students from Rotman programs will have access to individual Capital IQ accounts.
Capital IQ organizes historical information on companies, markets, transactions, and people worldwide, providing clients with the data necessary to analyze company fundamentals, build financial models, screen for investment ideas, and execute other financial research tasks. Some key features and functionalities of Capital IQ:
Capital IQ Dashboard: The specific purpose of the Capital IQ dashboard would depend on how its users customize it and what financial analysis or data tracking is needed. Multiple Capital IQ dashboards can be created that are typically customizable interfaces within the Capital IQ platform. It allows users to organize and visualize financial data, market information, and other relevant metrics according to their specific requirements. Some common purposes of the Capital IQ dashboard include portfolio monitoring, financial analysis, market trends, news and alerts, data visualization, comparable analysis, market research, valuation analysis, watchlists, M&A tracking, and so on.
2. Companies: Capital IQ offers comprehensive information about public and private companies, including financial statements, key financial ratios, executive profiles, ownership information, historical data, and news updates. It provides access to industry-specific data and reports, perform financial modeling and analysis, track information about mergers, acquisitions, divestitures, and other corporate transactions, and watch news article, press releases, and other current market-related information.
3. Markets: The platform provides access to real-time and historical market data, stock prices, trading volumes, and other market-related metrics.
4. Screening: Users can create custom screens to filter and identify companies or investment opportunities based on specific criteria.
5. Charting: The platform provides tools for creating charts, graphs, and visualizations based on the data available within the system.
6. Coverage: Managing portfolio by looking after various companies under various project groups.
7. Excel Integration: Capital IQ offers Excel plugins that allow users to pull data directly into their spreadsheets for further analysis and manipulation.
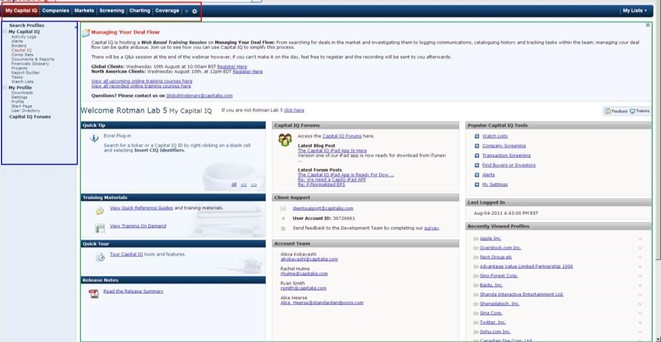
Capital IQ is organized by six Top Menu options – My Capital IQ, Companies, Markets, Screening, Charting, and Coverage. Every Capital IQ page follows the same layout:
Top Menu Bar: provides access to other features of Capital IQ such as “Companies”, “Markets”, “Screening”, Charting”, and “Coverage”.
Left Menu: list of functions that are specific to each option of the Top Menu bar
Body: displays selected information
My Capital IQ
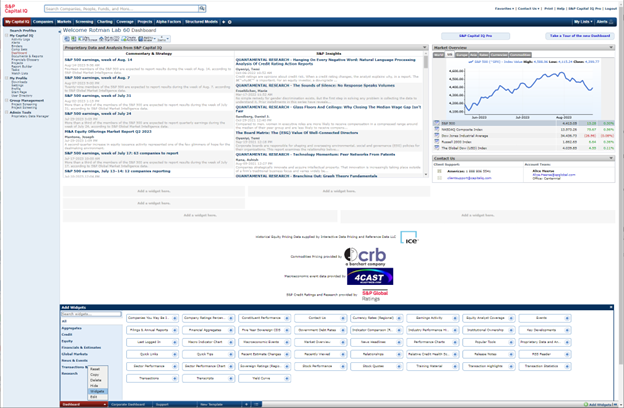
Dashboard
It is the first page that will welcome you after logging in with your credentials. You can create a Customize dashboard by clicking on the triangle beside Dashboard at the bottom. Click on Widget, select Layout, and then add the features that would support your research. A customized dashboard helps to quickly access the critical information that would affect your investment decisions.
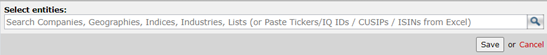
After selecting the widgets and layout, add the entities (companies or companies of a particular region, index, or industry) that you would like to observe. This gives the opportunity to monitor stock price changes closely and make decisions based on market movements.
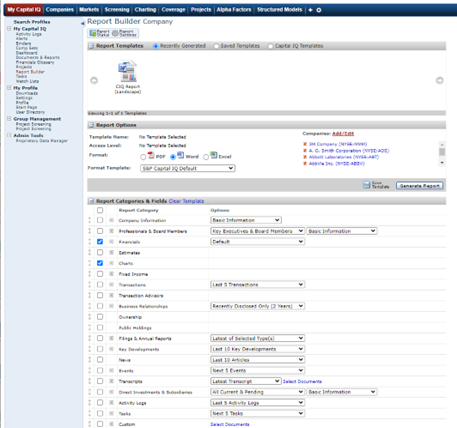
Report Builder
Capital IQ (CIQ) has many user-friendly features including the Report Builder. This function allows clients to develop a custom-formatted report for your added companies with the fields chosen from the categories below.
Companies
To search for a company, either:
Use the Search Box at the top of the page, above the Top
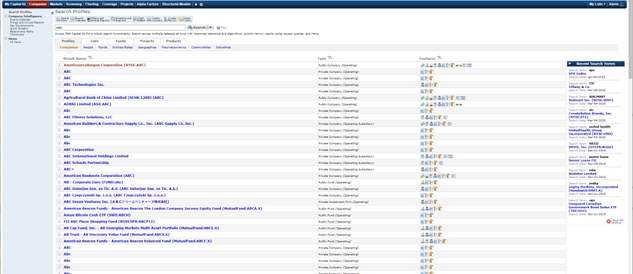
Click on the Companies tab in the Top Menu and select the Search Profiles
Or directly click on the company if it has been added to the dashboard.
The following screenshots use AmerisourceBergen Corporation – ABC as an example.
Option 1: Using Search Box
Option 2: Using Search Profiles
Option 3: From the Dashboard
Company Summary
CIQ provides a comprehensive overview of a specific company, offering a wealth of information and data that is valuable for financial analysis, investment research, and due diligence.
After selecting the desired company, it will be directed to its Tearsheet page. Tearsheets are designed to provide quick and easily digestible information for investors, analysts, and financial professionals. These pages are often used to make informed investment decisions and are frequently found in financial databases, investment platforms, and research reports.
The CIQTearsheet page provides a company’s basic information, business description, industry classification, corporate governance, primary office location, stock price and trading data, historical performance, key financial metrics, ownership and insider trading, recent news and events, peer comparison, dividend information, key ratios, SEC filing links, and subsidiaries.
Tearsheets are a convenient way for investors to quickly assess the key aspects of an investment opportunity or company without delving into lengthy reports or financial statements. However, they should be used as a starting point for research.
“Corporate Timeline” feature that allows users to access historical data and events related to a specific company. This feature helps users visualize and understand a company’s history and key events over time.
To know the names of the industrial competitors of the selected company go to “Competitors”. Clicking on any of the companies in the competitors’ list will lead to its Company Summary-Tearsheet page.
Financials/Valuation
This function provides a detailed list of financial information used to analyze and evaluate companies. It provides access to Key Stats, Income Statements, Balance Sheets, Cash Flow statements, Multiples, Ratios, and other important financial indicators.
Users can change the template, frequency of data (for example from annual to quarterly), and the period. Download the table in an Excel file either by clicking on “Download This Page” or “Download Financials”. The former allows to save only the table that is open on the CIQ platform. The latter allows to download the tables under the Financials/Valuation that is from Key Stats to Segments all at once.
Estimates
CIQ (Consensus Estimates and Guidance) plays a crucial role in financial analysis and investment decision-making. It helps financial professionals, investors, and analysts in several ways: earnings expectations, investment decision-making, valuation, risk assessment, benchmarking, market sentiment, communication with stakeholders, and tracking performance. It’s important to note that CIQ estimates, and guidance are not infallible. They are based on the collective opinions and forecasts of analysts, and actual results can vary. Therefore, investors should use CIQ estimates as one of many tools for making investment decisions and conduct thorough research and analysis before making any investment choices.
Peer Analysis
It allows users to quickly compare a company’s financial metrics and valuation multiples to those of its peer companies. This tool is valuable for conducting peer group analysis, which is a common practice in financial analysis for benchmarking a company’s performance against similar companies in the same industry.
Quick Comps in CIQ is a powerful tool for financial analysts, investors, and professionals to assess how a company stacks up against its competitors and to identify potential investment opportunities or areas of concern. It helps provide context for evaluating a company’s financial health and valuation relative to its industry peers.
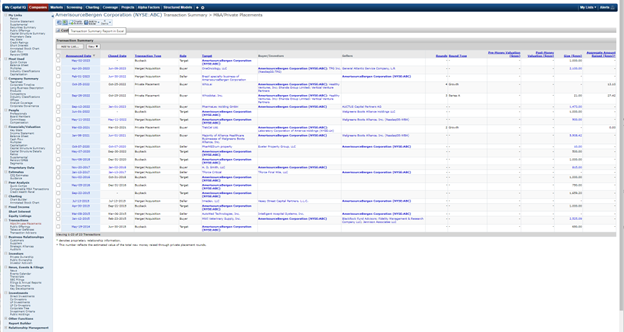
Transactions
CIQ offers a comprehensive database of financial and business information, including data related to mergers and acquisitions (M&A) and private placements. The “Transaction M&A Private Placements” feature in CIQ typically provides information and insights into these specific types of corporate transactions.
The Transaction M&A Private Placements section in CIQ is a valuable resource for financial professionals, investment analysts, and researchers interested in monitoring and analyzing corporate transactions. It can provide insights into market trends, deal activity, and the strategies that companies use to grow or raise capital.
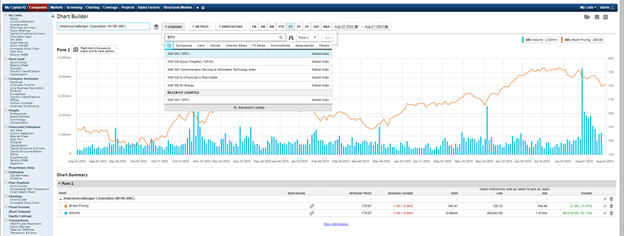
Chart Builder
It’s a valuable feature for financial analysts, investors, and researchers who want to visualize and analyze data in a way that suits their specific needs. Users can create custom charts and graphs based on financial and market data. Select the company, metrics, and time frame for the chart. Compare with other assets by selecting their tickers.
Charting
Charting in CIQ is a versatile tool that empowers users to perform various types of financial analysis, from assessing a company’s financial performance to tracking market trends and conducting technical analysis on securities. It provides users with the capability to create various types of charts and graphs to visualize financial and market data. This feature is valuable for financial analysts, investors, and researchers who want to analyze and track data trends, compare performance, and make informed decisions.
Some of the key features and functionalities that Charting includes: selecting chart types, data series, and time frames, customizing the appearance, making comparable and technical analysis, adding notes, saving charts, and exporting at the end.
Markets
Market Analysis
Capital IQ provides coverage of global financial markets, including major stock exchanges, bond markets, and commodity markets from around the world. The Market Analysis page provides a quick analysis of the entire industry, divided into twelve major sectors, as well as in-depth research on selected sectors. Some of the important features are:
Industry Performance – highlights some of the best and worst performing industries. In addition, users can view a graph comparing the performance of twelve major sectors to the S&P 500 Index.
Sector Performance – lists key financials and ratios to give users a clear picture of the position of each industry in the market.
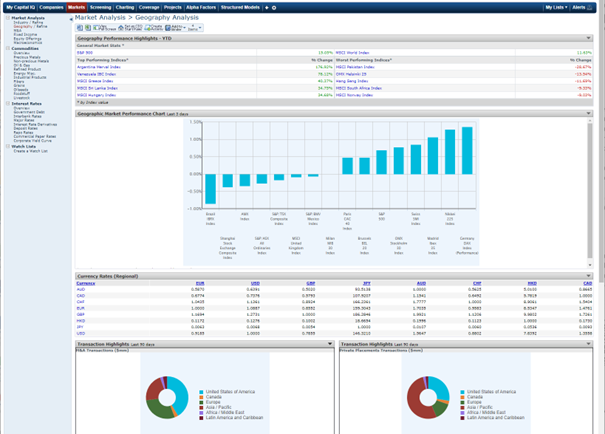
Geographic performance – compares the performance of the major stock indices of different countries and shows the currency rates movement.
Commodities
It provides futures contract information on commodities, such as price per unit, settlement price, price change, volume sold, exchange at which it is traded, expiration date, and contract size.
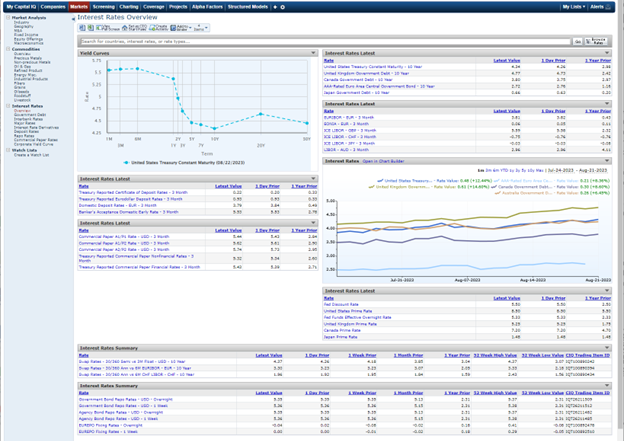
Interest Rates
Shows how the yield rate varies for US treasury bonds of different terms. In addition, presents the LIBOR rates at which countries can borrow from each other and the interest rate paid on government bonds.
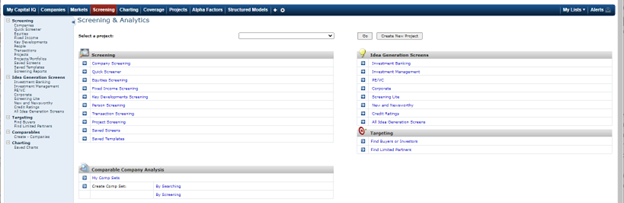
Screening
CIQ screening tool is designed to help users filter and identify specific companies or investment opportunities that meet their criteria. It’s a powerful feature for financial analysts, investors, and researchers looking to narrow down a list of potential investments or conduct market research. This feature allows users to find comparable companies, people, key developments, and transactions according to a wide selection of screening data points.
Company Screening – a full in-depth screening tool that allows you to screen companies based on hundreds of characteristics.
Quick Screener –quickly screen companies based on a few attributes.
Key Developments – screen for companies by corporate actions e.g. SEC filings, bankruptcies, transactions.
Transaction Screening – Screen companies by M&A transactions, Growth Capital transactions, Equity Buybacks, PIPE transactions, new issues, and transaction details.
Idea Generation Screens– Find potential M&A opportunities, undervalued companies, distressed or potentially distressed situations, arbitrage situations, and more.
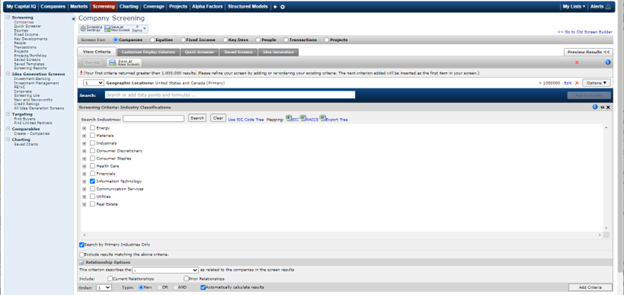
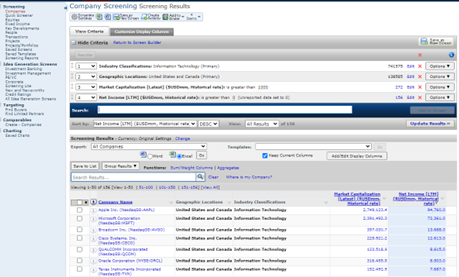
Company Screening
The Company Screening is a flexible and customizable feature that allows users to sift through vast amounts of financial data to identify companies or investment opportunities that align with their specific investment strategies and criteria. It allows clients to select criteria and then apply filters and conditions to meet specific conditions.
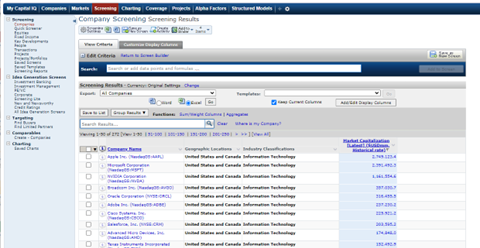
Clicking on a criterion link opens the category field at the top of the page with filtering options – typically a list of available company characteristics or inequalities for numerical data. Choose the desired items to screen on and set up the values as required. Then click Add Criteria. Below are screenshots highlighting the numerous options to narrow down the result. Click on View Results to see the data.
Click on Edit Criteria to add new criteria or edit old ones to narrow your search results. Click on Update Results to see the new table.
Users may have the option to export the screened results for further analysis, or they can save the screen for future reference.
Quick Screener
Helps to quickly screen companies based on a few attributes, such as industry, geographic location, company type, indices, and a few basic fundamentals.
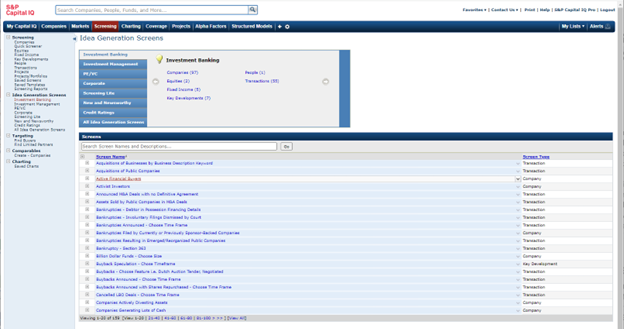
Idea Generation Screens
Some pre-defined screening criteria are set based on research objectives in various financial fields.
For example, how an investment banker would identify all the active financial buyers in the market.
Coverage
The Coverage section in Capital IQ serves as a valuable resource for accessing information about financial analysts and their research coverage of publicly traded companies. It facilitates investment decisions, market analysis, and corporate engagement with the investment community. It is in general used by financial professionals and organizations seeking to access analyst research, make informed investment decisions, and stay updated on market sentiment and company coverage within the financial industry.