Lorem ipsum dolor sit amet, consectetur adipiscing elit. Ut elit tellus, luctus nec ullamcorper mattis, pulvinar dapibus leo.
Introduction
FactSet is a research platform that integrates financial data from various third-party financial information resources into a flexible and open technology. It is a global provider of integrated financial information, analytical applications, and services for investment and corporate actions. It consolidates data into analytics that professionals need to monitor global markets, public and private companies, and equity and fixed income portfolios in a single, intuitive interface.
The advantage of using FactSet is that it provides data and analytical applications to global buy and sell-side professionals, including portfolio managers, market research and performance analysts, risk managers, sell-side equity researchers, investment bankers, and fixed-income professionals. Financial professionals utilizes the Company’s content and multi-asset class solutions across each stage of the investment process.
The goal of FactSet is to provide a seamless user experience spanning idea generation, research, portfolio construction, trade execution, performance measurement, risk management, reporting, and portfolio analysis. FactSet currently serves many financial professionals that include portfolio managers, investment research professionals, investment bankers, risk and performance analysts, wealth advisors, and corporate clients. It operates in all areas of the financial industry: provide insights on global market trends, access extensive company and industry intelligence, monitor portfolio risk and performance, and execute trades.
FactSet is a comprehensive financial database that allows retrieving financial data either through its Workstation (downloaded from https://www.factset.com/download) or through an Excel plugin which makes it easy to download and format data. FactSet’s Workstation includes real-time news and quotes, company and portfolio analysis, multi-company comparisons, industry analysis, company screening, portfolio optimization and simulation, predictive risk measurements, alpha testing, and tools to value and analyze fixed-income securities and portfolios.
FactSet is available on our computers at BMO FRT Lab. In addition, all Rotman faculty, graduate, and undergraduate students from Rotman programs can access remotely by requesting an individual FactSet account.
FactSet Workstation
FactSet provides a customizable and flexible workspace, allowing users to tailor their interface to suit their specific needs and preferences. One of the key features of FactSet is the ability to save workspaces online. This means that users can save their customized layouts, charts, tables, and other data views so that they can access them from any device with an internet connection. This is particularly useful for those who work across different computers or need to access their setups remotely.
Another valuable aspect of FactSet’s workspace is the ability to share workspaces with colleagues. By doing so, team members can collaborate more effectively, view the same data, and work on projects together in real-time, fostering better communication and coordination. In terms of navigation, FactSet aims to be user-friendly and efficient. Users can switch between different tabs and views using either the mouse or keyboard shortcuts, allowing them to quickly move around the platform and access the information they need.
From the menu, you can launch and manage your workspace, components, tabs and sub-tabs. Here is a summary of some basic functions of each main category:
Learning Portal: Access Courses designed to develop your skills and knowledge of FactSet.
Today’s Top News: Find market news, company news, investment research, and content online.
Markets: Access world market data, including indices, gainers & losers, volume, economic reports, etc., and compare market performances and countries’ data.
Quotes: Monitor market data (with Market Watch), and access quotes and historical prices of equity, option, and futures.
Charting: Chart market data and economic series
Economics: View calendar of economic data releases, access Economic information by country/region, and access economic data comparisons and estimates.
Industry: View overviews, financials, and reports on sectors, industries, and regions.
Company/Security: Access all the available information, estimates, and valuations of public and private companies, private equity, and venture capital funds.
Filings: Search for corporate filings and transcripts including all regulatory filings.
Screening: Screen for equities and ideas (potential investment opportunities, find potential buyers, track trends, and identify precedent transactions)
Portfolio: Create, track, and evaluate portfolios and/or custom composites in real-time.
Ownership: Research ownership details, recent activity, and key ownership statistics about a company, officers, and directors affiliated with public and private companies and private equity firms.
Creating Custom Dashboard
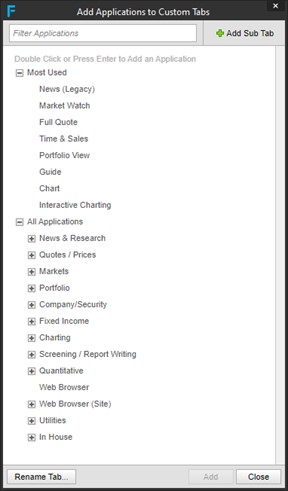
Click the plus button next to the tab where you want to create a new.
Then, launch a desired component from the FactSet Insert.
Add the required applications that you may want to add to your personal dashboard.
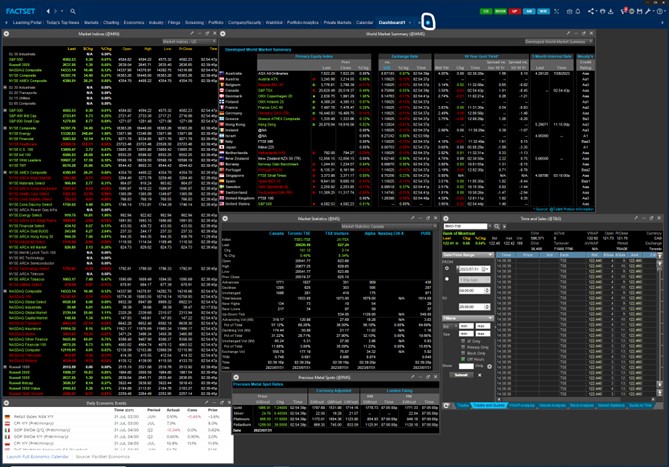
For example, in the tab named Dashboard1, all the applications are included from Markets| Real-time Market Quotes. Market Indices, World Market Summary, Market Statistics, Prices, and Times and Sales are all connected to real-time data feed.
Create a Customized Dashboard (Tab) using various applications shown above.
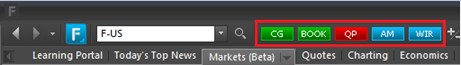
For the predefined workspace, click on a shortcut icon in the toolbar to launch the corresponding component.
CG is for Company Guide, Book is for Book Builder, QP is for Quick portfolio, AM is for Alert Manager, and WIR is for Wireless Configuration.
Enter keywords into the FactSet Search box. As you type, the FactSearch drop-down menu will populate with results related to the search keywords. The drop-down menu is separated into the following sections:
Entities – Includes security types such as equities, indices, people, mutual funds, and private companies
Components – Includes all the components found in the FactSet Insert menu
Series & Reports – Includes economic charts and series that are available in Economic Analysis Charting
Search Online Assistant – Opens an Online Assistant search page with a list of help pages that include your keyword
Some Useful Keyboard Shortcuts
To activate the FactSet Insert menu, press ALT + F.
To display a component outside FactSet, press ALT + O.
To activate FactSearch or the Master Identifier box, press CTRL + T.
To navigate to the lowest tab layer, press ALT + [1-9].
To toggle up/down through the tab layers, press CTRL + Up Arrow or Down Arrow.
To move the cursor left in a tab layer, press CTRL + Left Arrow or Page Up.
To move the cursor right in a tab layer, press CTRL + Right Arrow or Page Down.
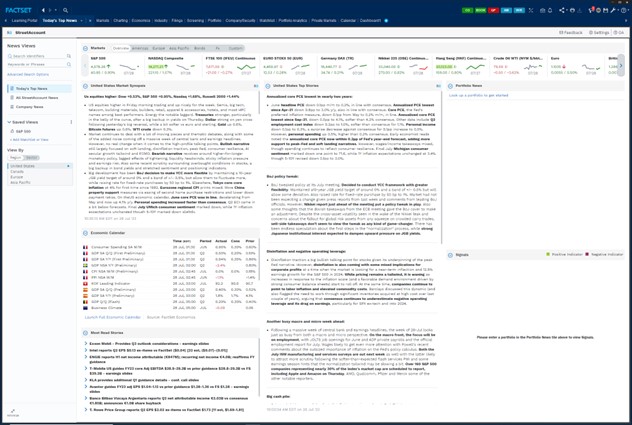
A. Today’s Top News:
Provides an update on all the global market news and its impact on financial assets.
B. Company/Security:
Search the Company name or ticker(s) under the tab Company/Security or Search button at the top left.
If you are uncertain of the identifier of any securities, in the FactSet search button select ID Lookup.
To investigate the financial condition of a company, search the company name, narrow down the results with the categories on the left and the region on the right, and select the security. It is possible to narrow it down even further by choosing the region and exchange. Double-click the identifier in the rightmost box or click Add Selected to add the identifier to the selection box. Finally, click OK and the selections should be added to Company/Security.
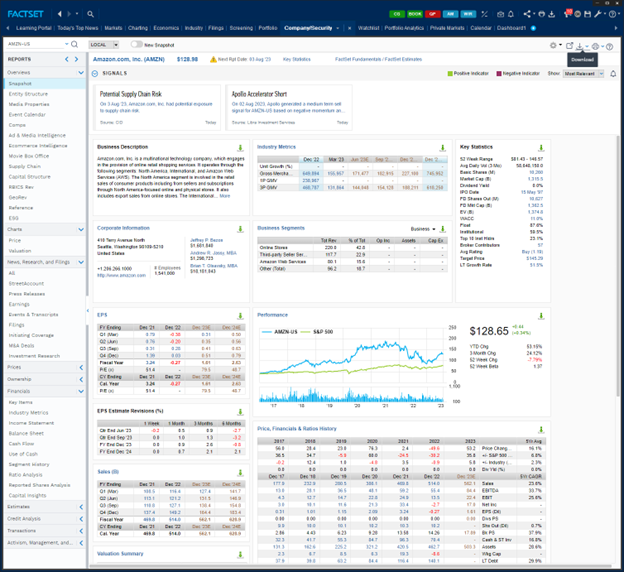
The Overviews-Snapshot will give you an idea of the business description, corporate information, EPS, sales, performance, valuations summary, growth summary, historical information, key statistics, and so on.
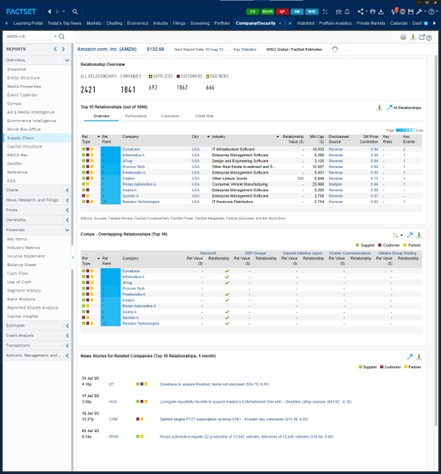
The Supply Chain under Overview identifies all the supplies, customers, and partners.
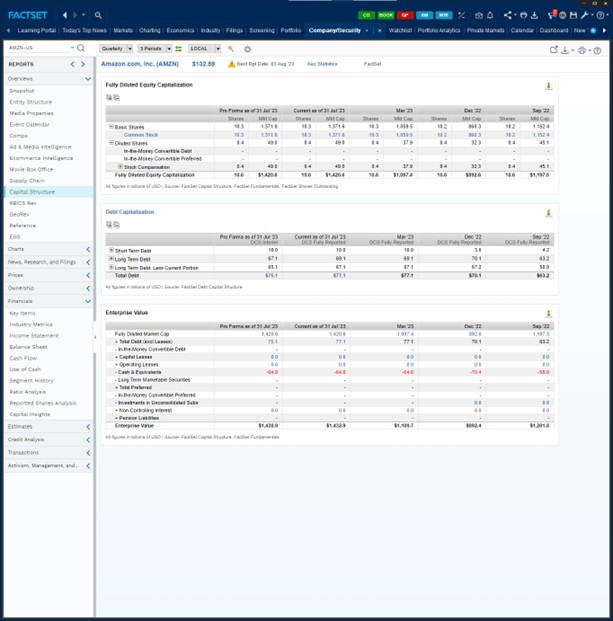
The Capital Structure shows the company’s debt structure and enterprise value.
ESG section tells you about the ESG scores, ratings and ranks obtained by the company.
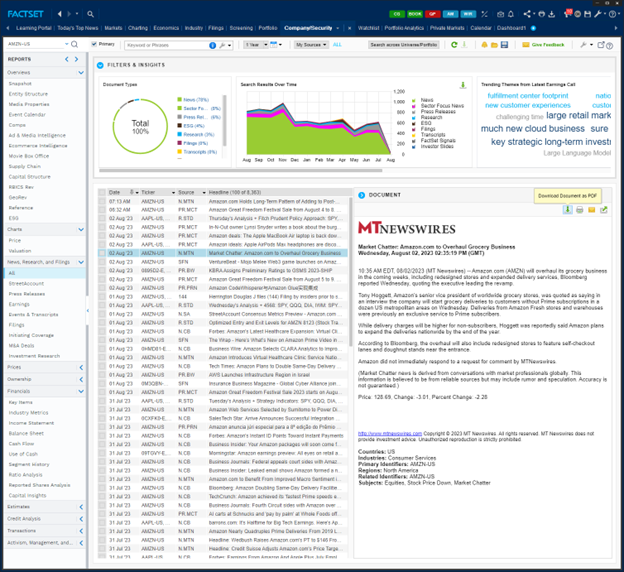
News will show all the events related to the company that potentially affect its performance. Download them by clicking on the down arrow.
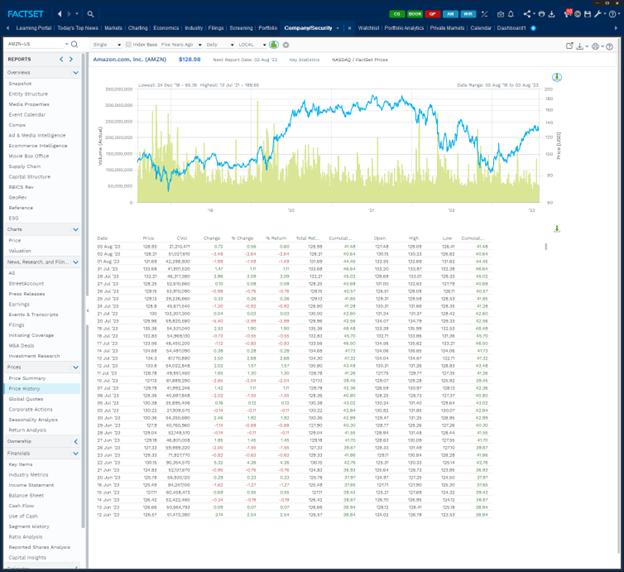
Price history provides you with the historical price and volume information. You can download them by clicking on the down arrow. Corporate Actions under Prices informs about stock split and dividend payment.
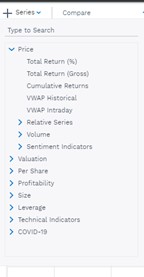
Chart presents the chart on price history and volume. You can add new series to the chart such as EPS, VWAP, and so on. You can compare the price movement with other securities as well. If you want to download the chart and data, click on the down arrow.
Ownership Summary shows the top shareholders of the company and its ownership statistics.
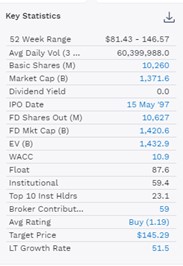
Financials will give you a detailed valuation summary, including access to the income statement, balance sheet, and cash flow statements. Key statistics will provide information on shares outstanding, market cap, and WACC. You can change the period of data from the last ten years to the last 5 years or provide a custom date.
Under Financials, we can find detail reports on income statements, balance sheets, cash flow statements, and ratio analyses. These reports can be downloaded by clicking on the down arrow.
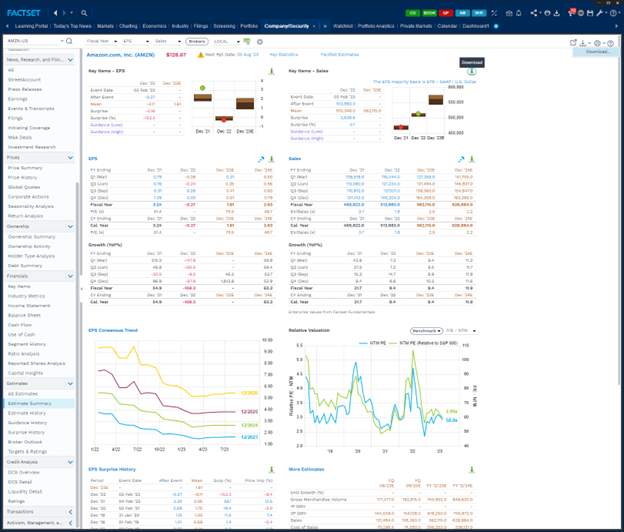
Estimates Summary is for the EPS, growth, and sales forecast.
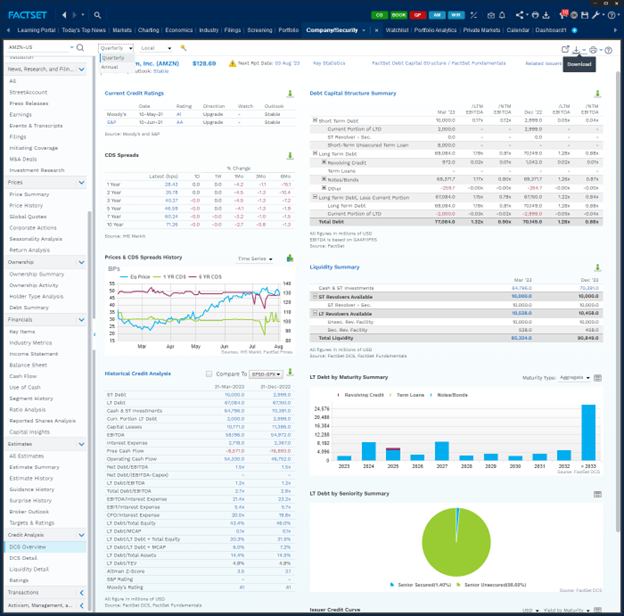
Credit Analysis provides information on its debt capital structure, liquidity situation, credit ratings, CDS spreads, and basically everything related to its creditworthiness.
C. Charting:
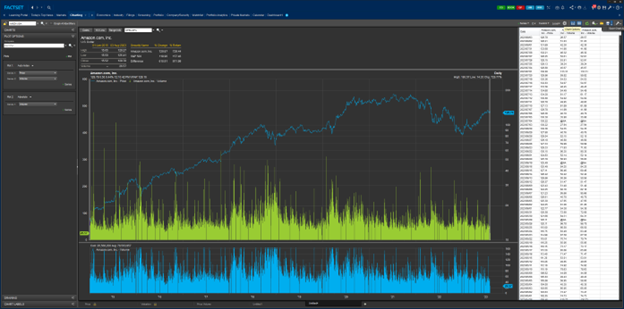
Alternative charts of any company can be obtained under the tab named CHARTING. To chart a security, go to FactSet Menu > Charting > Chart. If you already have the identifier in the search box at the top, or you have selected an identifier from the Identifier Lookup, FactSet will automatically chart the symbol for you.
Charting Specific series:
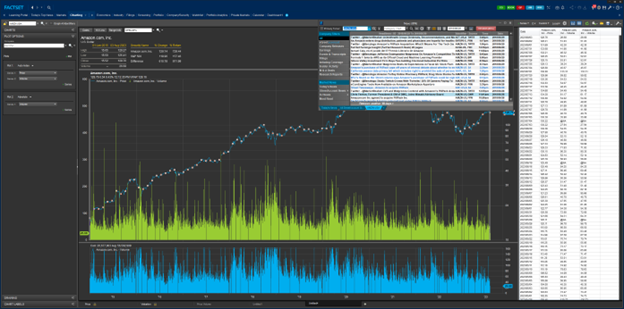
You can add new series in the same plot. For example, we used price and volume in Plot 1 or created a new plot in with volume. You can change the series by dragging down the triangle button, which will show you all the categories.
2. You can select to show prices or report or save both in an Excel file.
3. You can select to show prices or report or save both in an Excel file.
4. For “Fixed Income”, select “Yields” and “YTM” to graph the Yield to Maturity of the 30-day US Commercial Pape.
5. To change the date range, click the gear button on the top right side and a pop-up “Chart Options” should.
6. Choose the desired date range by clicking the calendar button to the right of the “From” and “To” labels. Hit Enter.
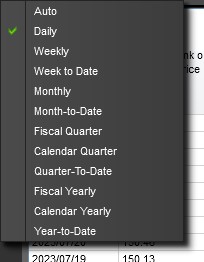
7. Click the D button and change it from “Daily” to “Monthy”.
8. Click the “Show Report” Button beside the gear button to see the report and the data table.
D. Market Watch:
Market Watch is one of the most used components in FactSet. It allows you to create a list of real-time quotes on equities, bonds, commodities, currencies, and indices. To open it, follow: FactSet insert menu > Quotes / Prices > Market Watch.
As we type, a drop-down menu will appear, and we will select the ticker we are looking for. If you don’t know the ticker(s), just simply type in the name of the ticker, and you will be able to screen out the results.
After you are done, we will be able to monitor your personal security list.
If you would like to monitor some other fields, right click on the market watch window > select Options > and you can browse through available columns and add new column.
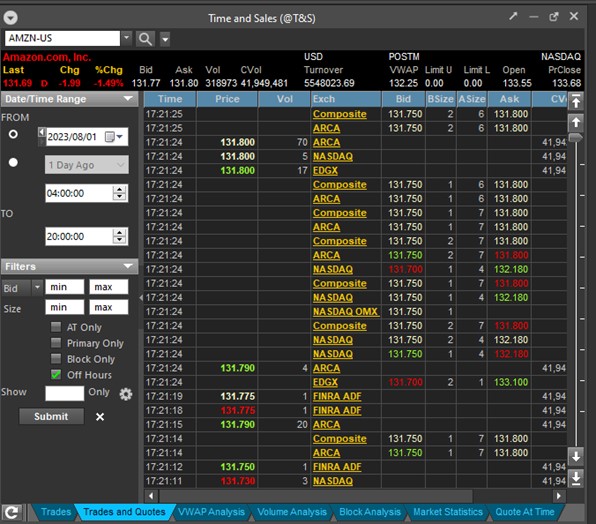
E. Time and Sales Data:
To view a market Volume-Weighted-Average-Price (VWAP) for certain security using FactSet, you can add Time & Sales application in a New Tab. Within the application fill out the Date/Time Range and filter side bar to your desired settings. In the search bar at the top type your security ticker; we will use Amazon (AMZN-US) as an example.
After entering your security, press the ENTER key. In our case, the security name will be “AMZN-US”. If followed correctly, your window will look similar to the one above. If you are unsure about FactSet naming conventions, you can type the name of your security and FactSet should automatically populate a list with the possible results. The ending result will look like the screenshot below.
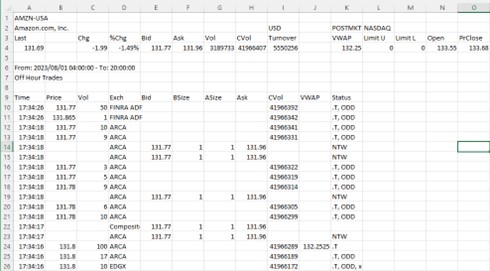
The next step will be to export the data to Excel to perform your calculations. To do this right click within the table and press “Download Report…” A window will pop up asking where you wish to save the document, you can download the document anywhere, but it should be saved as a “.csv” file to ensure proper number formatting. The data can be copied or saved elsewhere after it has been downloaded. Determine what data will be used in your calculations and copy this into a new Excel file. Downloaded data will look like the screenshot below.
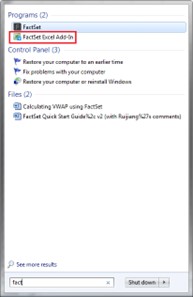
FactSet Excel Add-in
To launch the FactSet add-in, search “ FactSet Excel” in the start menu and select the “FactSet Excel Add-In” shown below. This will have to be done even if Excel is already open.
2. If FactSet isn’t working in Excel please contact the Financial Research & Trading Lab assistants.
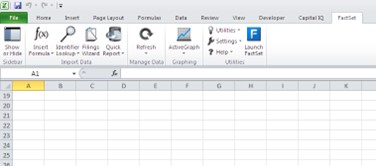
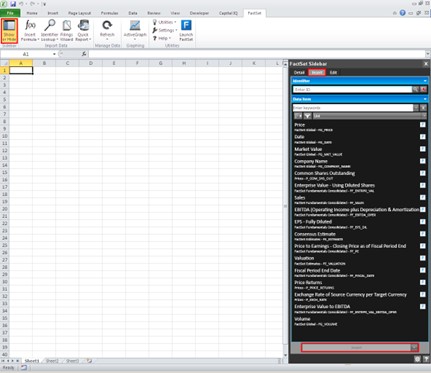
3. When FactSet Add-In is enabled and opened properly, you will be able to see FactSet on the toolbar.
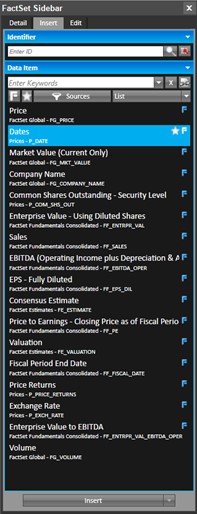
To insert a simple table of a data item versus date, you can click Sidebar > Insert, select the identifier(s), the data item and input details, and then hit Insert at the bottom.
Note: You can only retrieve one type of series at once using this method.
Formula Lookup (FQL)
To look up a formula, go to the Insert Formula Dropdown Menu > Insert Formula, and the FactSet sidebar will pop up.
With Insert Formula, you can search and select the Formula you will use to download and retrieve data from FactSet.
Retrieving Data
There are two ways to retrieve data – Data Downloading and =FDS Codes.
Using =FDS Codes
=FDS codes are DDE (dynamic data exchange) codes that make a direct call from Excel to FactSet’s mainframe. =FDS codes contain both the identifier and the data item. They calculate in the spreadsheet with your codes, so FactSet does not create a separate data file (i.e., you only work with one spreadsheet).
The FactSet Sidebar will allow you to identify =FDS codes through the formula look-up bar. To download data, first add security identifiers to the sidebar in the “identifier” field as shown below.
Then include your desired data through the “Data item” field, to request data search for a metric, the example uses EBIT, and press enter. The sidebar will show items that match with your search terms. Select a metric and press insert to input the data to a cell.
To change the template, you would simply change the FDS formula. As for refreshing your data, you can go to the FactSet Ribbon > Refresh Dropdown Menu > select All =FDS Codes.
Using =FDS Code Syntax
The general syntax for using =FDS codes in Excel is as follows:
=FDS(“[symbol]”,”[item(date)]”)
Items in square brackets signify inputs of the formula.
An example of retrieving Ford Motor Co price data is: =FDS(“F-US”,”FG_PRICE(0)”)
Unlike Data Downloading codes, there is no caret (^) at the beginning of an =FDS code. Instead, the formula begins with =FDS. The symbol and item are enclosed in quotation marks.
Using FDS Codes for Time Series Data
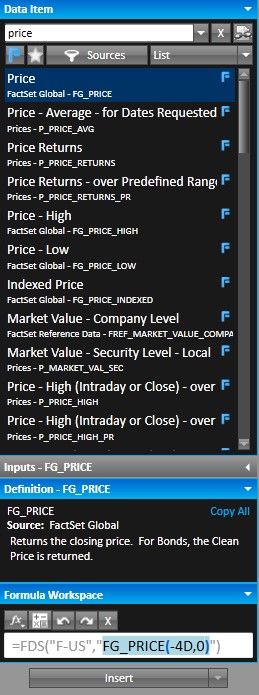
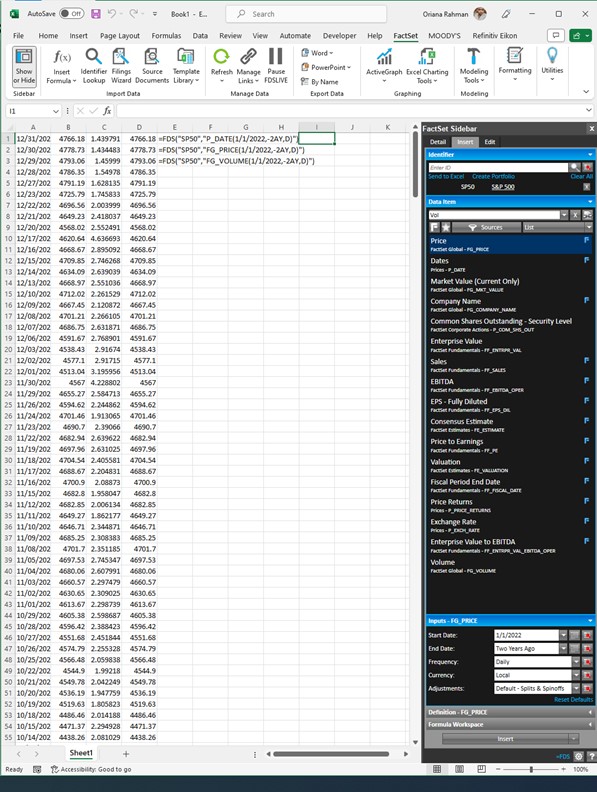
Use the Factset Sidebar to generate FDS codes for time series data. Much like the earlier function specify the identifier and data item that you wish to pull. After searching for a data item, such as price, select which formula you would like to use. In the example below we selected Price, which then shows three additional tools: Inputs, Definition, and Formula Workspace.
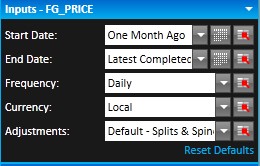
The inputs tab allows you to specify certain characteristics for each data item. For Price, you can select the Date range you want to look at, the frequency of data, currency displayed and adjustment items. The parameters below show daily price data from one month ago to the last price in local currency accounting for stock splits and spinoffs. These parameters can be customized to suit the data being pulled.
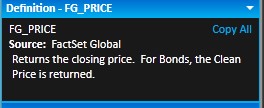
The Defintion tab shows exactly what the formula will be pulling. The picture below shows that this price formula will specifically pull the closing price.
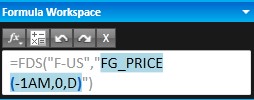
The Formula Workspace tab allows you to view the FDS code that will pull the specific data that you want to pull. You can also edit this code manually to reflect a different request.
When you have finalized all of the parameters you wish to pull regarding time series data click insert to retrieve the values in excel.
Example of downloading data-date, price, and volume of S&P 500 at daily frequency for the last two years.
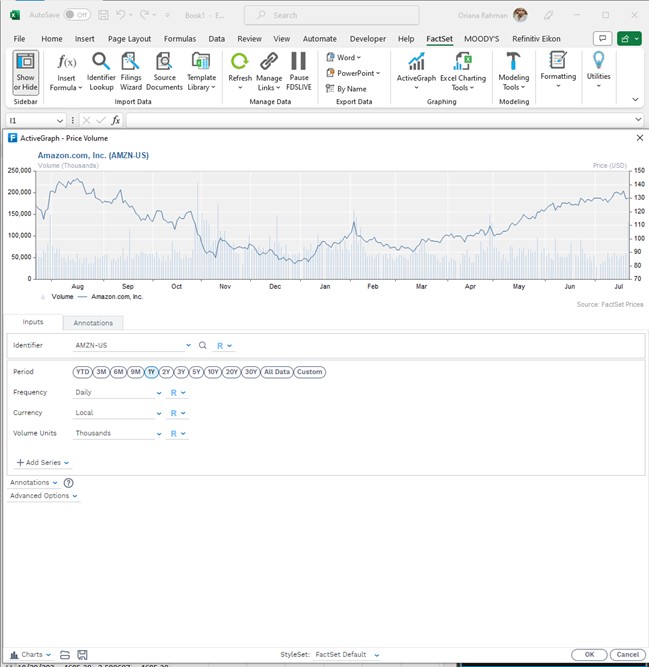
ActiveGraph
ActiveGraph allows to create charts and graphs from FactSet data. You can search the company as Identifier, select the frequency of data to be used in the charting, and choose the currency. You can add more variables.